Google AI Mode Introduces Interactive Financial Charts
Google is rolling out a new feature in AI Mode within Labs: interactive data visualization for financial queries. Users can now ask complex financial questions and receive visual charts alongside detailed explanations. These responses are tailored to each user's specific question.
Visual Analytics in AI Mode
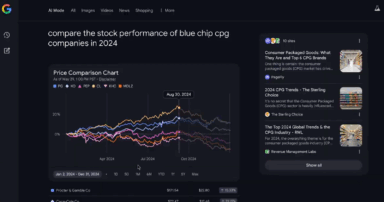
Soufi Esmaeilzadeh, Director of Product Management for Search at Google, explained how users can ask questions like "compare the stock performance of blue chip CPG companies in 2024" and receive automated research with visual charts. Google automatically researches individual companies and their stock prices, eliminating the need for manual searches.
Follow-up questions, such as "did any of these companies pay back dividends?", are also supported. AI Mode understands the context and provides relevant information.
Technical Details and Implications
This feature is powered by Gemini's advanced reasoning and multimodal capabilities. The system analyzes user requests, gathers current and historical financial data, and presents the information in the most effective visual format.
Financial websites that rely on comparison content should monitor their analytics closely. This feature may impact traffic as Google provides direct visual answers to complex financial questions. However, it also presents opportunities for publishers to offer deeper analysis and expert commentary, adding value beyond basic data visualization.
Availability and Access
This data visualization feature is currently experimental and available through AI Mode in Labs. Access it through Google's Labs program. There's no official announcement yet regarding wider rollout or expansion beyond financial data.
Looking Ahead
This move reinforces Google's strategy to become a primary information source. While currently limited to finance, this technology could expand to other data-rich industries. This experimental feature offers a glimpse into the future of AI-powered search.